This has info on js web developer tools for debugging, inspecting, analyzing — things like Chrome DevTools, Firebug, and Firebug Lite.
Browser-based developer tools
When starting out with JavaScript most developers use simple debugging tools, for example you display values in alert popups or you write diagnostic messages to the console. And that's often sufficient when it's just simple JavaScript you're doing. But when you want to build serious JavaScript-driven applications that run a lot of code on the client you need serious developer tools. There are several options here, including IDE debuggers, built-in browser tools like Chrome DevTools, and add-ons like Firebug. And for mobile there are web inspectors like Weinre, Chrome's USB debugging, and Firebug Lite. If you are unfamiliar with these tools you should take a look at this overview to get a general feel for their functionality.
While some IDE's have great debuggers you really should learn the in-browser developer tools of the major browsers. All have a JavaScript debugger and console, obviously essential, but equally important are their other features — tools that let you inspect the DOM, that let you view and dynamically modify the CSS for any element, that let you monitor network traffic and view server request results, that let you analyze performance including memory usage. Suggestion: learn one tool in-depth (IMO Chrome DevTools is the tool of choice) but also learn the basics of the other browsers tools — you'll find this useful when you hit browser-specific problems whose debugging sometimes requires using tools in the browser where the problem is occuring.
An important but probably underused feature of these browser devtools are their profilers and analyzers. These tools can help you optimize your application's performance and memory use. That last one is critical to SPAs, and something most web page developers haven't needed to worry about previously. After all, you rarely encounter memory problems when you're working with simple web pages that live only until the next browser refresh. Memory leaks usually go unnoticed if a page isn't around long enough to consume significant memory, since any problems go away when the page is refreshed and memory allocated to that page is reclaimed. But JavaScript Single Page Applications don't have page refreshes and this makes memory leaks a concern. A major leak can affect not only your own application's performance but can also impact other browser pages and processes. On mobile where memory is limited an application that gobbles memory can crash its page or even the entire browser session. Which can be very embarassing. So, take the time to learn how to identify and kill memory leaks. Chrome DevTools make this very accessible so you really have no excuse not knowing how.
The rest of this post just provides some summary info on a few different tools and then provides links to more detailed info on each.
Chrome DevTools
Ok, I'm going to cheat here and just quote from the Chrome DevTools intro page since it has a nice succinct definition: "The Chrome Developer Tools (DevTools for short), are a set web authoring and debugging tools built into Google Chrome. The DevTools provide web developers deep access into the internals of the browser and their web application."
To the above I'll only add that DevTools is absolutely amazing and indispensible. Read this DevTools main page to see what DevTools has to offer, and you can dive even deeper through the resources listed below. Mastering this toolset (or a similar toolset like Firebug) is one of the best JavaScript developer investments you can make. It will make you more efficient and, more importantly, can help save your sanity when you hit a really nasty bug.
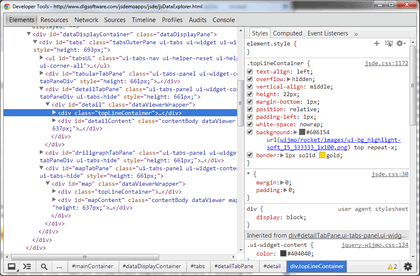
Screengrab showing DOM elements to the left, CSS to right
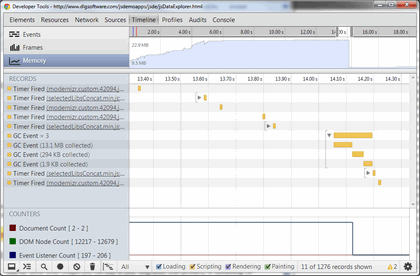
Screengrab showing Timeline of memory usage
General Resources
- Google's "Chrome DevTools Overview"
- Sixrevisions.com has a list of quality "Google Chrome DevTools Tutorials"
- Paul Irish's video "Google Chrome Developer Tools: 12 Tricks to Develop Quicker"
- Google I/O usually addresses the state of Chrome DevTools, here's a video from Google I/O 2012 and here one on Chrome DevTools 2013 enhancements (2014 is below in the section on device testing since that was the main focus of the 2014 talk)
- Addy Osmani has a Chrome Devtools "State of the Union" for 2015, both video and speakerdeck
- Majd Taby's very useful post on webkit inspector (part 1)
- Andi Smith post on devools secrets
- Smashing's "JavaScript Profiling With The Chrome Developer Tools"
- tutsplus.com tutorials on tools and tips for Chrome DevTools and JS performance
- Addy Osmani and Paul Irish video series on using Chrome DevTools (episode 1)
- Addy Osmani on performance optimisation with timeline- and profiles
- Addy Osmani on using DevTools to optimize and debug - "Taming the unicorn - easing JavaScript memory profiling with DevTools/
- developers.google.com on using DevTools for CPU profiling
- to keep up with new features you can check out html5rocks, with info on updates are often available there — for example here's "DevTools Digest - Chrome 35"
Chrome DevTools device mode
As we'll see in a moment, Chrome DevTools has features to help you debug JavaScript apps running in Chrome on your mobile device (see Chrome USB debugging below). That's great when you have the device handy, but what do you do when you want to test on a device you don't have? Yes there are emulators you can install or online sites that offer emulation, but Chrome DevTools also has a wonderful mobile device emulation mode that you can use for your development and initial testing.
Here are some features of Chrome DevTools device mode:
- presets for dozens of devices including all models of iPhone and iPad and many Android devices from Samsung, HTC, Sony, etc.
- sets correct device pixel ratio, including retina display
- honors viewport setting
- honors and displays active media queries and shows which affect your page
- touch emulation (fires touch events, not mouse events, and suppresses hover events)
- lets you modify user agent
- lets you throttle network to emulate slower cell phone networks
While Chrome DevTools device mode doesn't emulate all mobile devices with 100% fidelity it's usually very close, especially with some devices. This makes it incredibly useful as you're developing, giving you a quick approximation of how your page will lay out on a smaller screen. Very importantly it does honor media queries and displays these above your layout as colored bars, clearly showing which impact your page. And of course because you're doing this in Chrome DevTools you have all the standard features that can make life so much easier — ability to inspect and modify the DOM, to see and change CSS values, to monitor network traffic, to find and destroy performance bottlenecks, etc.
Note that Chrome DevTools device mode isn't perfect (e.g., device setting can get lost when switching to landscape) and there are some limitations (see realeyes.com post below for some of these). Despite its limitations Chrome's device mode is absolutely worth a look if you aren't already using a full-featured emulator. See the links below for more info.
TIP: As of this writing there's an issue with loading a page with a device profile already selected (e.g., iPhone 5) — sometimes the page clearly doesn't lay out correctly. If this happens just selecting a different device (e.g., iPhone 6) and then returning to your original setting (iPhone 5) will usually correct the problem.
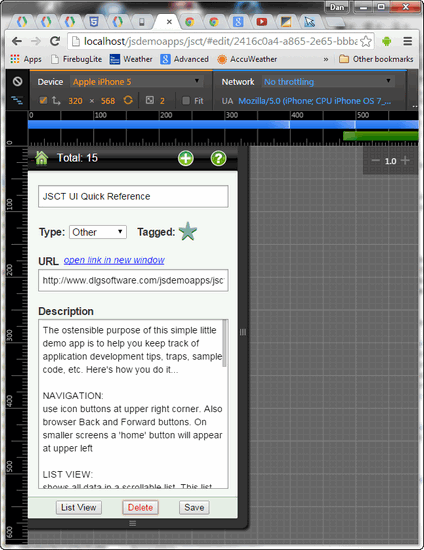
Chrome DevTools in device mode
Bottom line with device mode is that it's extremely useful but not perfect, so use it for development but for final deployment be sure to test on as many physical devices as you can.
Resources: DevTools mobile device mode
- Google Chrome developer site intro to device mode
- Google's video overview of DevTools device mode
- cross-device development and testing was the main focus of "Google I/O 2014 - Developing across Devices - DevTools in 2014"
- this realeyes.com post "A Quick Guide to Chrome’s New Built-in Device Emulation" is excellent
Mobile web devtools
Mobile browsers don't have the wide-ranging developer tools you'll find in desktop browsers. In fact, while some older mobile browsers have a console available (e.g., Android stock browser) most don't have even that. And of course just having a console isn't what you want, you want to be able to inspect the DOM, view CSS properties, analyze network traffic, etc. There are tools for this, it's just not quite as simple as using the built-in tools of desktop browsers. Some options include Safari's web inspector, Weinre, Chrome DevTools USB debugging for mobile, and FirebugLite. I'll focus on those last two.
Chrome USB debugger
Chrome DevTool remote USB debugging feature lets you debug Android Chrome sessions using the same Chrome DevTools you use for desktop. Literally — you'll do your debugging in a desktop Chrome instance, with that desktop machine connected to your mobile device via USB. Note that this is only Chrome-to-Chrome, so you can't use this for debugging something happening in a Safari session (though Apple has a web inspector with essentially the same functionality).
To use Chrome's USB debugging you need a bit of the Android sdk, something called adb (Android debug bridge). If you have the Android sdk installed then you're good to go. If you don't then you can install it or take a much simpler route, installing Paul Irish's ADB plugin for Chrome. Note that Windows users will also need a USB driver. UPDATE: forget the above info on ADB, Goggle has made things even easier, now there's no setup required: "You no longer need to configure ADB or the ADB plugin to debug remote browser tabs and WebViews. Remote debugging for Android is now part of the standard Chrome DevTools."
Resources: Chrome DevTools remote for mobile
- developers.google.com on DevTools remote-debugging
- html5rocks.com page on mobile profiling
- Youtube: The Breakpoint Ep. 7: Profiling a mobile site with Chrome DevTools and Android (and other episodes, esp 6 and 8)
Firebug Lite
Firebug Lite is a simple fallback for mobile debugging when Chrome USB isn't an option. I say it's a fallback only because Firebug Lite is a less good option because it has fewer features then Chrome DevTools. On the other hand Firebug Lite has an advantage — it's incredibly simple. In fact if you want to use the bookmarklet then there's no installation, you just add some JavaScript to a link you can put on your bookmarks bar, or you can simply put that js in a link on a page (to test drive Firebug Lite on this page use the "test drive" link below). Note that Firebug Lite doesn't have everything that you get in Firebug (or Chrome DevTools), and it really isn't designed for a phone (better used on tablet) but it's certainly better than trying to diagnose problem using the console or alerts.
Try this link for a test drive: Run Firebug Lite (be patient, takes a moment to load). You can click here to send "howdy!" to the console.
Note that I've had some problems displaying script files at times, occasionally getting access errors or the wrong file displayed, but overall Firebug Lite is a very useful tool for debugging mobile web apps.
{if(F.getElementById(b))return;E=F[i+'NS']&&F.documentElement.namespaceURI;E=E?F[i+'NS'](E,'script'):F[i]('script');E[r]('id',b);E[r]('src',I+g+T);E[r](b,u);(F[e]('head')[0]||F[e]('body')[0]).appendChild(E);E=new%20Image;E[r]('src',I+L);})(document,'createElement','setAttribute','getElementsByTagName','FirebugLite','4','firebug-lite.js','releases/lite/latest/skin/xp/sprite.png','https://getfirebug.com/','#startOpened');)
Resources: Firebug Lite

JavaScript
JavaScript appdev primers
General JavaScript
SPA Demo Application
Backbone Demo Application
Recommended sites
- Addy Osmani's blog
- Derick Bailey's Backbone posts
- Murphey's JQuery Fundamentals (original)
- Crockford's JS videos
- MSDN Project Silk
Flex/AIR
Flex/AIR primers
- Primer on Flex/AIR Multiscreen Development
- Primer on Mobile App Development w/Flex 4.5
- Primer on Flex 3 Component Lifecycle
- Primer on Flexlib MDI
Flex demo apps
all require Flash Player!
AIR mobile dev
- AIR mobile dev Tips
- AIR and Android Back key
- AIR, StageWebView, displaying local content
- AIR for Android memory issue w/large images